Unplanned internet downtime can bring your operations to a grinding halt, resulting in lost revenue, productivity, and other costs that are less obvious but longer-lasting. Yet, 19% of B2B SMBs and 27% of B2C organizations say they do not feel their businesses are prepared to deal with unexpected downtime.
Many of those businesses struggle with internet reliability because they simply don’t invest enough in their Internet foundation to support today’s new cloud and SaaS business technologies. IT can’t justify the cost of improving their internet stack because the ROI feels hard to articulate in a way the business can understand. In fact, 38% of SMBs say they don’t know the cost one hour of downtime is for their business.
In this post, we’ll share some of the industry-standard calculations you can use to determine your own cost of downtime. It’s our hope that, by understanding the true cost of downtime, you can make the ROI case for the internet foundation your business needs.
How to calculate your cost of downtime
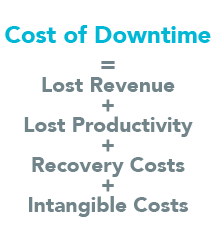
Gartner provides this helpful equation to calculate the full cost of downtime.
Cost of downtime = Lost revenue + Lost productivity + Recovery costs + Intangible costs
According to a Gartner survey, the average cost of network downtime is about $5600 per minute, which adds up to well over $300K per hour. This is an average calculation. On the low end, Gartner assessed that downtime cost can be $140K per hour to a high estimate of $540K an hour.
These differences can be attributed to several factors, such as your industry, size of your organization, duration of the outage, the time of day of your outage and what’s affected at that time, how much your business relies on the internet, etc.
The hard costs of downtime
Let’s take a closer look at the first half of this equation, with factors that are based in numbers you probably already know.
Lost revenue
Lost revenue = Revenue/hr * duration of downtime (hrs) * uptime reliance (%)
Revenue is one of the more straightforward numbers you can identify as it directly relates to what your business generates. However, you should also consider what percentage of your revenue is affected by downtime.
For example, if your business has retail locations using POS equipment to accept payment, it’s likely that more of your revenue will be affected by downtime. In comparison, if you are running a medical clinic where you have a wider variety of activities that contribute to revenue generation, downtime may not affect your revenue as much.
Gartner often looks at data that relates to larger enterprises. So, the numbers above may not seem like they apply to your small to medium sized business. Let’s look at an example that might resonate more.
Example:
Let’s think about a call center that makes $4M a year in revenue. As a call center, their employees’ reliance on uptime is 100%. This would calculate their lost revenue at $2,083 for the incident.
Lost revenue per hour = Revenue/hour * duration of downtime (hrs) * uptime reliance(%)

Total lost revenue = $2,083 * 1 * 100% = $2,083
Lost productivity
Lost productivity = Avg. employee salary/hr * number of employees affected * duration of downtime (hrs) * uptime reliance (%)
Lost productivity is related to the cost of your employees’ salaries that must still be paid even when they can’t use the cloud applications that are affected by the downtime. This number can also be affected by uptime reliance. If your employees’ jobs are 100% reliant on your internet being up and running because all the tools they use are cloud or internet-based, then 100% of their salaries will be affected by downtime. Also consider the number of employees that are affected.
Example:
For this example, we'll keep things simple and just account for the employees who are working the phones. We won't figure in the administrative and other staff, even though their work would likely also be disrupted by downtime. In this call center, we have 75 employees whose salaries average $11/hour.
Lost productivity = Avg. employee salary/hour * number of employees affected * duration of downtime (hrs) * uptime reliance (%)
Lost productivity = $11 * 75 * 1 * 100% = $825
Adding it up so far
So far in this example, this business is already looking at a cost of $2,908 for this incident, which happened with an hour of downtime ($2,083 + $825 = $2,908).
Let’s tease this out to see what the annual cost would look like.
As part of Bigleaf’s SD-WAN technology, we monitor tens of thousands of internet circuits for performance and reliability. Based on that customer data, we’ve calculated that their connections are providing them with an average of 93.1% of usable uptime, and the remaining 6.9% translates to an average of 604 hours per year of effective downtime.
This probably sounds high to you because the numbers most ISPs talk about refers to “hard” downtime. This is when the circuit is completely unavailable. For example, when you can’t send a ping, the internet connection is hard down. Our calculations show that connections experience an average of 31 hours of this absolute downtime a year.
The 604 hours a year number above is accounting for both this hard downtime as well as “unusable uptime.” That’s when your internet connection is officially still up but performing in a way that creates a very unproductive experience. This significantly affects all the modern internet-based tools you’re using, such as Zoom or MS Teams. From your users’ perspective, the internet is working but not well enough for them to do their jobs. So, this needs to be included in your downtime calculations.
Example:
In our call center example, we’ve calculated the cost of an hour’s worth of downtime to be $2,908. That adds up to be approximately $1,756,432 of downtime cost for the year.
Cost of downtime in a year = Hours of downtime in a year * cost of an hour of downtime
Cost of downtime = 604 * $2,908 = $1,756,432
The “soft costs” of downtime
By just calculating the hard costs, our SMB example is already facing more than $1.75M in annual downtime costs. This doesn’t even consider the costs that are less easy to estimate but do factor into your total business cost. While those costs are called “soft” here, by no means is their impact subtle.
Recovery costs
Recovery costs = Repair services + Consulting services + Replacement parts + New hardware + Lost data recovery + Other costs related to repair and recovery
These are costs related to the task of fixing the issue, which can include repair and service costs, replacement costs, and lost data recovery costs. These totals need to be added to your running total. Review your previous years’ expenses in these categories to estimate what you might expect for recovery costs.
Intangible costs
Intangible costs can include a variety of things that have a greater and longer-lasting impact than the hard costs mentioned above. For example, as your IT team focuses on resolving the outage, they lose focus on their strategic initiatives.
Your brand’s reputation and customer satisfaction can also take huge hits, which can ultimately lead to the loss of existing and new customers. In fact, more than 37% of SMBs admitted to having lost customers due to downtime issues.
For some businesses, there can also be fines or penalties associated with any breach of agreement, such as not meeting the terms of an SLA. Others may face fees or payments related to litigation or settlements.
Even without dollar amounts, think about how sensitive your customers and teams are to downtime and the other costs they create for your business.
Use these questions to start evaluating your intangible downtime costs:
Amount of impact damaging your brand and increasing costs to your business

How often are your customers experiencing downtime that significantly impacts how they do business with you?

How easy is it for your customers to go to a competitor for a similar product or service?

How much are your teams having to redirect their focus from business initiatives to fix downtime problems or issues resulting from them?

How frustrated is your staff with their inability to do their work because of downtime?
How much effort do you need to put in to acquiring new customers to make up for the ones you’ve lost due to downtime?

Next steps
Use these calculations and assessments to better understand what downtime is really costing your business. Then you can start to compare your cost of downtime to the costs it would take to mitigate that downtime, such as:
- Installing additional internet connection circuits and simple failover
- Implementing reactive performance monitoring, Netflow, and/or troubleshooting tools
- Investing in proactive tools like Bigleaf, which can provide self-driving systems that use AI to automatically detect and resolve issues
Once you know what downtime is costing your business, it’s time to right-size your digital infrastructure investment. Use the SMB Internet Maturity Model to assess what kind of internet performance your business needs to achieve its operational and strategic goals.
Contact us
Contact us if you need guidance on assessing your cost of downtime or how to right-size the reliability of your connectivity. We can also walk through how hundreds of other SMBs are using Bigleaf to eliminate their downtime costs and getting an SLA-backed 99.99% uptime guarantee.